Section 5.1: Areas and Distances
In this section, we look at the areas under the curves of functions and the distance an object has travelled, given its velocity.
AREA:
Take a look at this curve:

Finding the area under this curve will be easy for us. All we have to do is multiply the base and the height.
Take a look at these three areas:
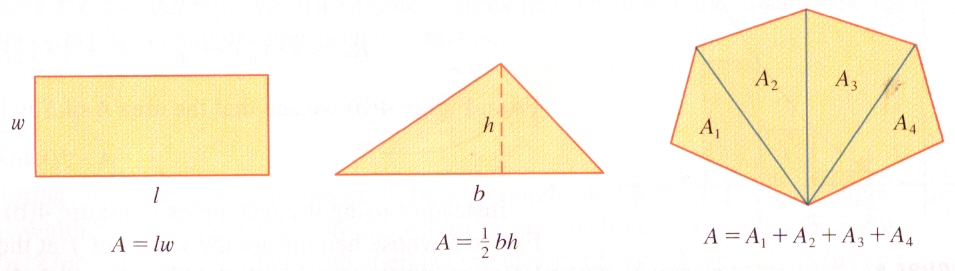
It should be easy here too.
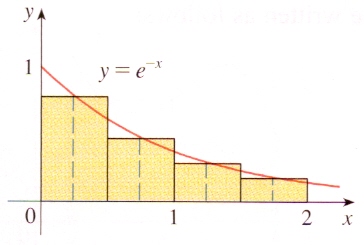
Now, we have a curve that is complicated:

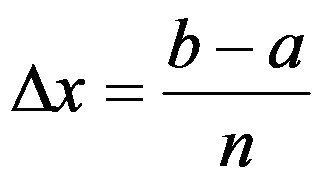
We can find the area under this curve by separating it into rectangles with equal intervals.
We find the width of the intervals by using this equation:
Then, a question comes: Which heights do we use?
We can use the heights to the left (LRAM: Left Rectangle Approximation Method) and the heights to the right(RRAM: Right Rectangle Approximation Method).
LRAM: Find height of initial x and extend left to interval.
RRAM: Find height of initial x and extend right to interval.
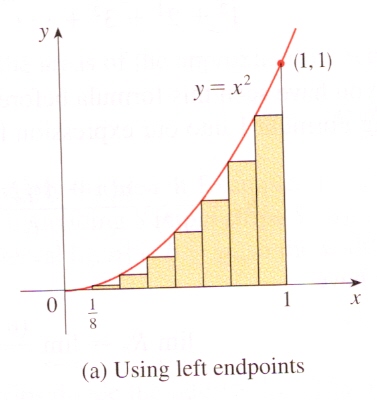
Let's take a look at y=x^2.
LRAM gives us:
RRAM gives us:
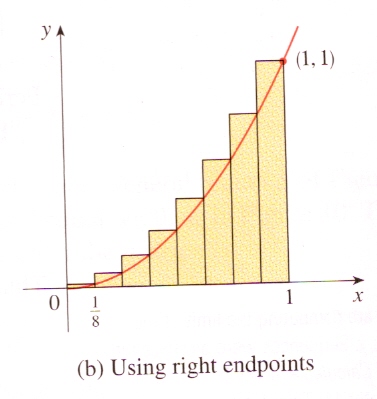
Notice that in this case, the RRAM gives us an overestimate (upper estimate). The LRAM gives us a underestimate (lower estimate).
We'll call the LRAM area Ln and the RRAM area Rn.
There is another method: the Midpoint Method (MRAM)
If we take the y=e^-x graph and use the MRAM, we get:
(There is another method: Trapezoid Method. We won't get into that now. However, if you want to, there is a link near the bottom.)
My interpretation is that these methods are ways to cut up a non-calculatable area into smaller calcultable areas.
These methods all give us approximations of the area under the curve. If we want to find a more accurate area, we can make the intervals infinitely small.
Defintion: The area A of the region S that lies under the graph of the continuous function f is the limit of the sum of the areas of approximating rectangles.
Using the right endpoints, we get:

We get the same value if we use left endpoints:

Distance:
When an object is moving along a straight line and we are given its velocity function, we can find the distance it has travelled using the concept we just learned.
The area under the curve of a velocity vs. time graph is the distance travelled.
This is because velocity=distance/time. So, distance= velocity*time If we add up all the changes in position, we can find the distance travelled.
Sample:
What is the area under the y=x^-1 curve between 1 to 4? (Use 3 intervals) Show both LRAM and RRAM. Which is lower? Which is upper?
Here we have the graph:

Using the interval equation:
(4-1)/3 = 1
Therefore, each rectangle must have a base width of 1.
LRAM:

We can find that the total area of the 3 rectangles is:
A=1(1+0.5+1/3)=1.8888... units squared
RRAM:

The total area is:
A=1(0.5+1/3+0.25)=1.083333... units squared
With these two answers, we can easily see that LRAM has given us an upper estimate and RRAM has given us a lower estimate.
Links:
Here is a site that may help you understand this concept further:
http://www.sosmath.com/calculus/integ/integ01/integ01.html
Here is a site that shows all 4 (left, right, midpt, trapezoid) methods and has a lot of pictures:
http://homepage.mac.com/nshoffner/nsh/CalcBookAll/Chapter%206/Ch6DefInt.htm
Here is a good video. This even shows some calculator procedures: (Quicktime required)
Quicktime 6: http://www.math.armstrong.edu/faculty/hollis/calcvideos/SV3/21-area.mov
Quicktime 7: http://www.math.armstrong.edu/faculty/hollis/calcvideos/H.264/21-area-H264.mov
Here is a comic. Enjoy!

Reminds me of a time when I did something like that...
Claire, you are next.
posted by Kane @ 9:51 PM
1 comments
![]()
![]()

1 Comments:
nice blog... the link with the video was especially helpful
Post a Comment
<< Home