5.2 The Definite Integral
So there's some notation for the Riemann sum that we did yesterday. If we take, for example, the area under the curve of y=x^2 from x=1 to x=3 like this:

and we want to have 2 rectangles with the sample points being left endpoints, then we would assign some notation. 1 would become x1, and 2 would be x2. To put this in notation we would use a capital sigma to symbolize sum. Underneath the sigma would be the starting point and over the sigma will be the ending point, both using i as the variable. The sum would be the sum of the rectangles, so it would be the height times the width (change in x). Put all this together and the equation would look like this:
To find the answer to this problem, we would plug in 1 for i then two, and add them. So it would be: f(x1)(x2-x1) + f(x2)(x3-x2) = f(1)(2-1) + f(2)(3-2) = (1)(1) + (4)(1) = 5.
We know from 5.1 that as you have more and more rectangles, the estimate of the area becomes more and more accurate. So ideally we would like infinitely many rectangles. We can write this as :

and to simplify this we use the integral symbol, and it would be :

Because as we get more and more boxes and n approaches infinity, the change in x gets closer and closer to zero so eventually the change in x becomes the derivative at x.
Take this graph and equation for example:

Let's find the area underneath the curve, but above the x axis.
Both the equation and the graph suggest that it's a semi-circle with a radius of 5. We could :

But common sense tells us that since we want want the area under the graph of a semi-circle, then we want the area of a semi-circle. So the area would be

This simple way of looking at the problem can be applied in different ways. Let's suppose we wanted to find the area between the curve and the x-axis if f(x) was 2x from x=0 to x=4 and f(x)=8 from x=4 to x=8 and f(x)=3x-16 from 8 to 10, then you could split that graph into two triangles and one rectangle and work out the area from there.

The area would be (1/2)(4)(8) + (6)(8) + (1/2)(6)(2) = 70.
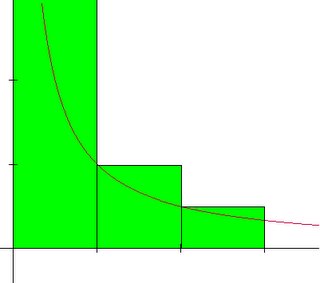
Another topic covered was the Mid-point estimate. Using the mid-point estimate balances out the over and under estimation, bringing us closer to the actual area underneath the graph.
Using the left side makes an overestimation, but using the right side is an underestimation. Using the midpoint, however, balances out the over and underestimation, making it about right.
There are some properties of integrals as well.
1.
2. If f(x)=c=7, and a=3 and b=5, then:
And:

Therefore:

3.

That's it!
Here's a couple of cute calculus pick-up lines:
1. "Hey, if I was sin^2x and you were cos^2x, together we would be one!"
2. "I wish I was your derivative so that I could lie tangent to your curves."
Here's a website about the properties of integrals:
www.analyzemath.com/calculus/Integrals/integral_properties.html.
Ismael, you're up next!


0 Comments:
Post a Comment
<< Home