Thursday, November 30, 2006

Friday's Quiz Topics

Here’s a list of topics that will be covered on this Friday’s Quiz. I’ll include the relevant homework problems as soon as I get a chance…

Quiz – Sections 4.5-7
Optimization (4.7, #7,11,28)
Calculus and Calculators (4.6, #37)
Analyze a graph based on equation (sketch, etc.) (4.5, #45,59)

I’ll be in early Friday, available after school this afternoon and I’ll check in tonight online. See you in class!

There's no point in being grown up if you can't be childish sometimes.
-Dr. Who

Wednesday, November 29, 2006

4.7 Optimization Problems

We can use what we've learned about finding extreme values of functions to solve real-world applications that involve optimization--maximizing or minimizing something for the best results. There are eight main steps in solving these types of problems:

1) Read the question carefully and understand what the goal is (what information you are looking for).

2) Draw a diagram and label everything.

3) Determine the maximum/minimum equation.

4) Determine the constraints.

5) Use the constraint relationships to reduce the maximum/minimum equation to one variable.

6) Use the maximum/minimum equation to identify local maximums/minimums by taking the derivative and finding critical points.

7) Test the critical points and endpoints to determine the absolute maximum/minimum.

8) Answer the question asked.

Here is an example:

You construct mini, customized above-ground pools. One customer requests that you line their pool with red tile. You only have a limited amount of red tile and it is more expensive than regular tile. So, you want to minimize the amount of red tile you use. All your pools must be 400 cubic feet in volume. Your pools have square bases. Find the dimensions that minimize surface area.

So, following our 8 steps:

1) Our goal is: find the dimensions (the width and height) of the pool that yield the minimum surface area and a volume of 400 cubic feet.

2) Draw a diagram: the base is a square so its sides are both w. The height is h.

3) The max/min equation is: , where w is the width and h is the height. Remember the base is a square, so the area of the base is . The total area of the four sides then is 4(wh). So you add and 4wh to get the surface area you need to cover with tile (the bottom of the pool and the four inner sides).

4) Now for the constraints. Based on logical dimensions, you can say w is greater than 5 and less than 20 and that h is greater than 0 and less than 10. Also, the volume must equal 400 cubic feet. So, you can come up with a relationship for the volume: .

5) Using the second constraint, you can reduce the minimum/maximum equation to one variable by solving the constraint for one variable. Choosing h would be easiest, so

. Then, plug this into the min/max equation to get

and then .

6) Now you take the derivative of f to find the maximums/minimums. You can also write f as. The derivative is . Set this equal to zero and solve to find the critical points:

w = 9.283

You can use the First Derivative Test to determine that 9.283 is a minimum. You can test using 1 and 10.

When w is less than 9.283, the derivative is negative and when w is more than 9.283 it is positive. S0, there is a minimum at x=9.283 because the derivative changes from negative to positive.

7) But is 9.283 an absolute minimum? When x is 9.283, f(x) is 258.53. Now test the endpoints of the domain of w--5 and 20. When w is 5, f(x) is 345 and when w is 20, f(x) is 480--both are greater than at w=9.283, so (9.238, 258.53) is the absolute minimum.

8) Our goal was to find the dimensions of the pool that yield the minimum surface area and a volume of 400 cubic feet. Luckily, we didn't lose sight of it, as is so easy to do. For the width, we got 9.283 ft. But we need the height too! We found earlier that

, so plug in 9.283 for w and you get 4.642 feet.

So our answer is:

9.283 ft by 9.283 ft by 4.642 ft.

Some cool links:

http://www.qcalculus.com/cal08.htm

http://tutorial.math.lamar.edu/AllBrowsers/2413/Optimization.asp

And here's a nice picture I took:

RYAN, you are up next.

Monday, November 27, 2006

4.6 Graphing with Calculus and Calculators

The main point of this section is that when plotting a graph using a calculator, the calculator can often be misleading. If the equation of a graph is highly complicated, the calculator can miss many important parts of the graph of the equation, such as extreme points. In order to fix this, you can adjust the window settings on the calculator to give you a better view of the graph. By using the first and second derivative, you can find the extreme points, the intervals of increase or decrease, inflection points, and the concavity of the graph. These values can help you determine a more appropriate viewing window for the graph.

For example:
Produce graphs of the above equation that reveal all the important aspects of the curve.

When you first graph the equation, you will probably get something like this by using ZoomFit on the calculator:


This graph does not reveal very much about the significant aspects of the curve. A more appropriate viewing window is needed. To make this process easier, find the first derivative.


Now find the extreme points. You can use the graph of the derivative to find them:


The extreme points are (-2.255,) and (1.098,)


Based on this, the intervals of increase are:

while the interval of decrease is: (-2.255,1.098)

In order to find the concavity and points of inflection, first find the second derivative.


Now find the points of inflection. It is easy to do this by graphing the second derivative:


There is only one point of inflection, which is at (-1.4128,)

The graph of f(x) is concave up during:

and concave down during:

From this information we can find a more appropriate view of the graph.


Thus this is a more appropriate view of the graph. The y-window is [-500,500]. The x-window is [-5,5]

Here is a link to a website that can help you with this topic: www2.edc.org/cme/showcase/KY/calcliesarticle.pdf

This site applies this topic, but uses sinusoids rather than polynomials. Otherwise it is the same thing as this section.

Isaac, you are next to post, since Luke is no longer here.

Now, to finish things up, here is a comic. Hopefully, the AP exam will not be like this:

Monday, November 20, 2006

4.5 Slant Asymptotes

I was having trouble editing my other post, so i created a new one for the stuff we learned today dealing with slant asymptotes. If you're like me, you never learned about long division involving a variable. Its very similar to normal long division.
First, I'll tell you about the application of long division. In rational functions, slant asymptotes occur when the degree(highest exponent) of the numerator is one larger than the degree of the denominator. A slant asymptote is a linear function (following the form y =mx + b) that is never reached by the function.

So a function can have no vertical or horizontal asymptotes, but it might have a slant asymptote.
To find the slant asymptote, use long division. For example: ( 2 - 3x^2)/(x-1)


start by setting the equation up as a normal long division problem.
to learn how to do long division go to this very helpful site (they explain it better than i can): http://www.purplemath.com/modules/polydiv2.htm

the result is -3x-3 + (-1/(x-1))
you only use the -3x-3 part of this because the rest is a remainder.
Therefore, the slant asymptote is y = -3x - 3

Thursday, November 16, 2006

4.5 Summary of Curve Sketching

To start things off, I'd like to remind Kyle to do the next blog.

this lesson is (as its title suggests) a summary of what we have learned thus far. I don't know about you, but for almost everything I learn, I make little devices or words to remember them. For this section, the things you need to remember when sketching a graph, given the equation are:
1. remember any Asymptotes
2. find the Intercepts of the graph -for y, plug in 0 for x, vice versa for x-intercepts
3. keep in mind the Domain
4. For time-saving's sake, see if you can apply Symmetry
5. use the derivative to find Intervals of increase/decrease on the graph
6. find Max's andmin's-- using the first derivative test, if f ' changes from positive to negative, it is a local max.
7. f '' =0 is a pt. of Inflection and where this f '' is greater than 0, it is Concave up.
8. Sketch the graph


You can rearrange the bold letters any way that helps you remember, but I personally like to think : I SAID MISC , or IM AIDS SIC
for any other creative ideas to remember these guidelines, comment on this blog....

for the graph of y = (5x^3)/(x+1)
asymptotes: when x is -1, there will be a vertical asymptote
intercepts: when x=0, y= 0.......... when y=0, x also must =0 place a dot at the origin
domain: when x gets increasingly negative, what happens? a negative over a negative equals a postive. so while the graph has an asymptote at x=-1, the graph will resume on the left of the x-axis and get increasingly large.
symmetry: there is no symmetry because the function is neither odd nor even.
Intervals: the der. is (using the quotient rule) [(x+1)(15x^2)-5x^3] / (x+1)^2

so this derivative starts out negative, but gets closer to zero, where it does some funky stuff, then becomes positive when x is positive. using this info, the graph will start out with a negative slope, then because of the asymptote become positive.

local max, min: the der. is 0 at -1.5 and 0 and undefined at -1
concavity: do some "simplifying" to get [(x+1)^2 (30xx+30x) - (10xxx+15xx)(2x+2)]/ (x+1)^4

the graph of f" is negative only between -1 and 0 so f(x) should be concave up most of the time

pts. of inflection: when f" = 0 x= 0

finally attempt to sketch the curve. You can check your graph on your calculator.


links: http://www.ugrad.math.ubc.ca/coursedoc/math100/notes/apps/graphs.html

http://www.mathgraphs.com/mg_clc7e.html
advice for next time: use an easier equation : )


the red sox just paid $51.1 million for the rights (not even the salary) of Daisuke Matsuzaka, a pitcher from Japan.... here he is......

Friday's Quiz Topics

Here’s a list of topics that will be covered on this Friday’s Quiz. I’ll include the relevant homework problems as soon as I get a chance…

Quiz – Sections 4.1-4
Find critical numbers of a function (Sec. 4.1, #41)
Verify a function satisfies conditions of Rolle’s Theorem or the Mean Value Theorem, then solve for “c” (Sec. 4.2, #1,11)
L’Hopital’s Rule – evaluate limits (Sec. 4.4, #15,21,47)
Sketch a graph given continuity and max/min conditions (Sec. 4.1, #7,11)
Analyze a function given an equation: determine increasing/decreasing intervals, max/min values, concavity intervals, points of inflection (Sec. 4.1, #29,49, and any of the questions in Sec. 4.5)
Analyze and draw a graph of a function given the graph of the derivative. (Sec. 4.3, #5,7,31)

I’ll be in early Friday. See you in class!

"Seven days without laughter make one weak."
-Joel Goodman

Section 4.4 Indeterminate Forms and L' Hospital's Rule


Alright so hopefully that comic got you ready for this section. Because it's on how you can get limits for infinities and zeros.
And just a heads up this blog is going to be slightly messy because I don’t have Equation Editor on my computer.


So first off, L’Hospital’s rule says that:

or, verbally, the derivative of a function f at point c is the same as the function itself if the function’s limit is equal to either zero or positive or negative infinity.


An example would be the equation we used in class

To find the limit, you need to plug in infinity for x.

We can see that it equals infinity over infinity, which is a indeterminate form. However using L’ Hospital’s rule, we can take the derivative of the function and start again. Thus, we can take the derivative of the function.

The derivative comes out to be 1over x. Then if you plug in inifinity, it is obvious that it nears 0. Thus the limit is zero.


Another problem is:

It's solution:

And how we can apply L'Hospital's Rule:


(taken from http://archives.math.utk.edu/visual.calculus/3/lhospital.1/index.html )

And now moving on to the other indeterminate forms. There are seven total that you need to know. The first two have already been mentioned: infinity over infinity and zero over zero. Those are called the indeterminate quotients. The indeterminate product is zero times infinity. The indeterminate difference is infinity minus infinity. The three indeterminate powers are zero to zero, infinity to zero, and one to infinity. In these equations infinity means a really really big number, 0 means a really really small number, and one means...one.

Here are some good sites if you are still confused after my amazing blog:
http://www.sosmath.com/calculus/indforms/otherquotient/otherquotient.html
http://archives.math.utk.edu/visual.calculus/3/lhospital.2/ (These are more problems if you want to test your self some more on L'Hospital's Rule)

Reminder to JOEY to post tomorrow’s notes!

Tuesday, November 14, 2006

4-3 How Derivatives Affect the Shape of a Graph

In this section, we learned how to use information about to give us information about .

Increasing/Decreasing Test

Since represents the slope of the curve at the point , tells us when the function is increasing or decreasing. The Mean Value Theorem we learned earlier leads to the conclusions:

1. When is positive, is increasing.

2. When is negative, is decreasing.

We can use these two statements to test whether a function is increasing or decreasing based on the first derivative. Hence, the name “Increasing/Decreasing Test”.

The First Derivative Test

We can also use the first derivative to find the local maximum and minimum of the graph of the function.

We first find the critical numbers of the function. Critical numbers are the x-values in the domain of a function when the derivative is zero or undefined. To find the critical numbers, set and solve for x.

Once the critical numbers have been found, determine whether each critical number is a local maximum, a local minimum, or neither. To do so, draw a number line, mark the number line , and mark the critical numbers on the line.

We know that is equal to zero at the critical numbers. Using the number line, we can find the sign changes for each critical number. These sign changes determine the nature of each critical number. This is called the First Derivative Test:

1. If the sign of changes from positive to negative at a critical value, then has a local maximum at that x-value.
2. If the sign of changes from negative to positive at a critical value, then has a local minimum at that x-value.
3. If does not change sign at a critical value, then there is neither a local minimum nor a local maximum at that x-value.

Example

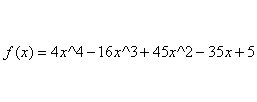
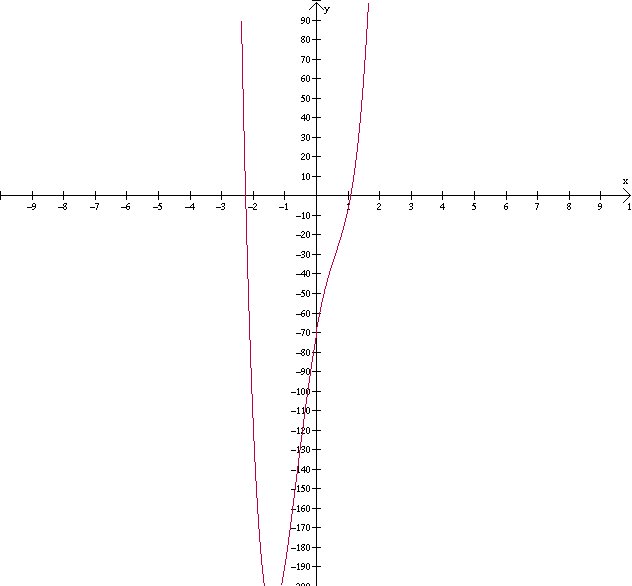
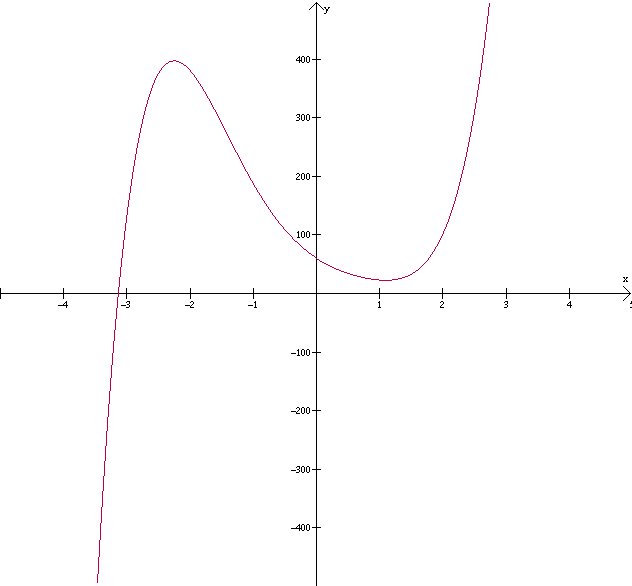
For , (a) Find the critical values & identify each as a local maximum, minimum, or neither. (b) State the intervals where is increasing.

Solution

Here is an example in which we use the Increasing/Decreasing Test and the First Derivative Test.
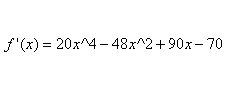
(a)


Now that we have the critical values, we create a number line and plot those values.


Using the First Derivative Test, we conclude the following:
Since changes from + to – at , is a local maximum
Since changes from – to + at , is a local minimum

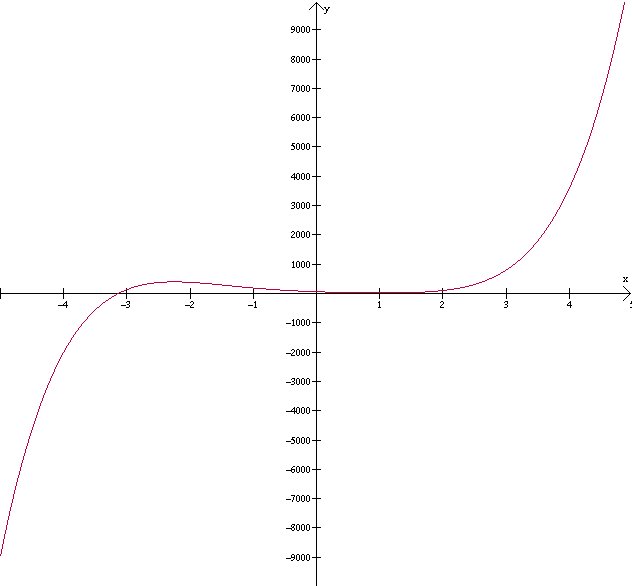
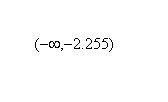
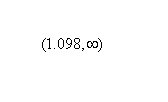
(b) Since is positive on the intervals to the left of -2 and to the right of 0, is increasing on the intervals and .

Concavity & The Second Derivative

The first derivative of a function helps determine the local maximum and minimum and also tells where the
function is increasing or decreasing. The second derivative tells us about the shape of the curve, its concavity, and also gives us the Concavity Test.

Look at Curve #1 below. In the graph, the slopes of the tangent lines change from negative to zero to positive. Therefore, the slope of the tangent, , is increasing. When a function is increasing, the derivative of , that is , is positive. This type of shape is concave up.

Look at Curve #2 below. In the graph, the slopes of the tangent lines change from positive to zero to negative. Therefore, the slope of the tangent, , is decreasing. When a function is decreasing, the derivative of , that is , is negative. This type of shape is concave down.

In Curve #1, there is a local minimum. In Curve #2, there is a local maximum. This gives us the Second Derivative Test:

If c is a critical number of , and
, then there is a local minimum at c.
, then there is a local maximum at c.

The Second Derivative Test is easy to use, but it is also limiting because there is no conclusion when . In that case, use the First Derivative Test, which can be applied in every case.

Points of Inflection

Points of inflection are points where the concavity of a function changes. Points of inflection are at values in the domain of a function where changes sign from positive to negative or from negative to positive.

We find points of inflection in a way similar to finding critical numbers. First, find of a function and solve for the x-values when is zero or undefined. These x-values are possible points of inflection. Next, draw a number line, mark the number line , and mark the x-values on the number line. We know that at these possible points of inflection is zero or undefined. Using the number line, we can find the sign changes for each of these points. If changes sign around the x-values on the number line, then that x-value is a point of inflection.

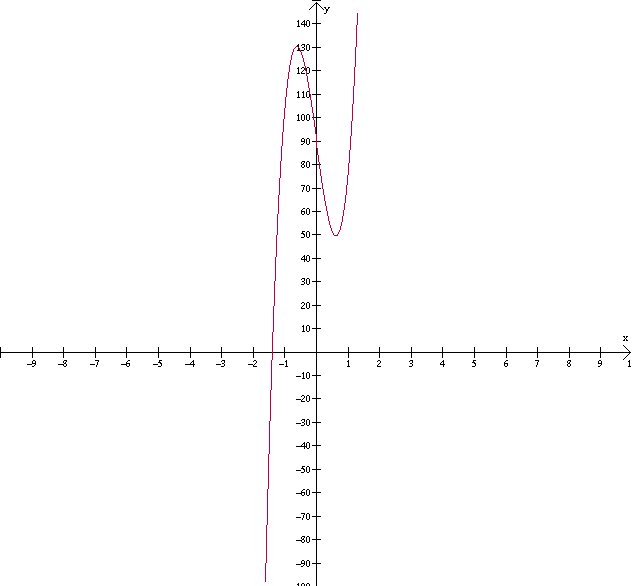
Example: Let us find the points of inflection of .

Solution:
We find the first derivative, .
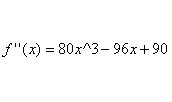
Then we find the second derivative, .

Since is never undefined for this function, find the points of inflection by solving:

changes from negative to positive around -1. Therefore, the point of inflection for is (-1, 6).

Two links you can check out for further information:

http://www.math.hmc.edu/calculus/tutorials/extrema/

http://www.math.hmc.edu/calculus/tutorials/secondderiv/

Reminder: Crystal, you are up to post next.

Here are some pictures I took at the Huntington Gardens: